Commands for CPU Monitoring
This topic describes two commands that are commonly used for CPU monitoring.
vmstat
The vmstat command is used to monitor processes, virtual memory, I/O, and CPUs of the OS. vmstat is an acronym of Virtual Memory Statistics.
Command output example:
# vmstat 1 5
procs -----------memory---------- ---swap-- -----io---- -system-- ------cpu-----
r  b   swpd   free   buff  cache   si   so    bi    bo   in   cs us sy id wa st
1  0   3340 1934580 656188 214762784    0    0     0    20    1    0  0  0 100  0  0
1  0   3340 1934548 656188 214762832    0    0     0     0  854  592  2  0 98  0  0
1  0   3340 1934548 656188 214762832    0    0     0     0  865  605  2  0 98  0  0
1  0   3340 1934548 656196 214762832    0    0     0    32  925  634  2  0 98  0  0
1  0   3340 1934548 656196 214762832    0    0     0     0  844  710  2  0 98  0  0
Parameter description:
| Parameter | Description |
|---|---|
| r | The number of runnable processes. |
| b | The number of processes that are waiting for I/O. |
| swpd | The amount of swap space. Unit: KB. |
| free | The amount of idle memory. |
| buff | The amount of memory that is used as buffers. |
| cache | The amount of memory that is used as cache. Larger cache indicates more cached files. If all frequently access files are cached, the value of **bi **will be small. |
| si | The amount of memory that is swapped in from disks per second. |
| so | The amount of memory that is swapped to disks per second. |
| bi | The number of data blocks received per second. |
| bo | The number of data blocks sent per second. |
| in | The percentage of available CPU time. |
| cs | The number of context switchovers per second. |
| us | The percentage of the CPU time spent in running user space processes. |
| sy | The percentage of the CPU time spent in running system processes. |
| id | The percentage of the CPU time spent idle. |
| wa | The CPU time spent in wait. |
| st | The percentage of the CPU time spent the hypervisor. |
info
- If the values of si and so are large, the kernel is swapping memory to disks.
- Larger values of bi and bo indicate higher consumption of I/O.
- Larger values of in and cs indicate higher frequency of communication between the system with the interface devices.
perf top
The perf top command can be used to monitor the CPU used by processes for calling functions.
Command output example:
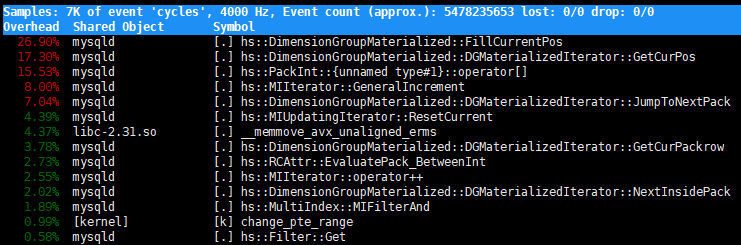
Parameter description:
| Parameter | Description |
|---|---|
| Overhead | The CPU utilization. |
| Shared Object | The name of the object that consumes CPU time, such as an application, kernel, or dynamic link. |
| Symbol | The name of the function, in most cases. |